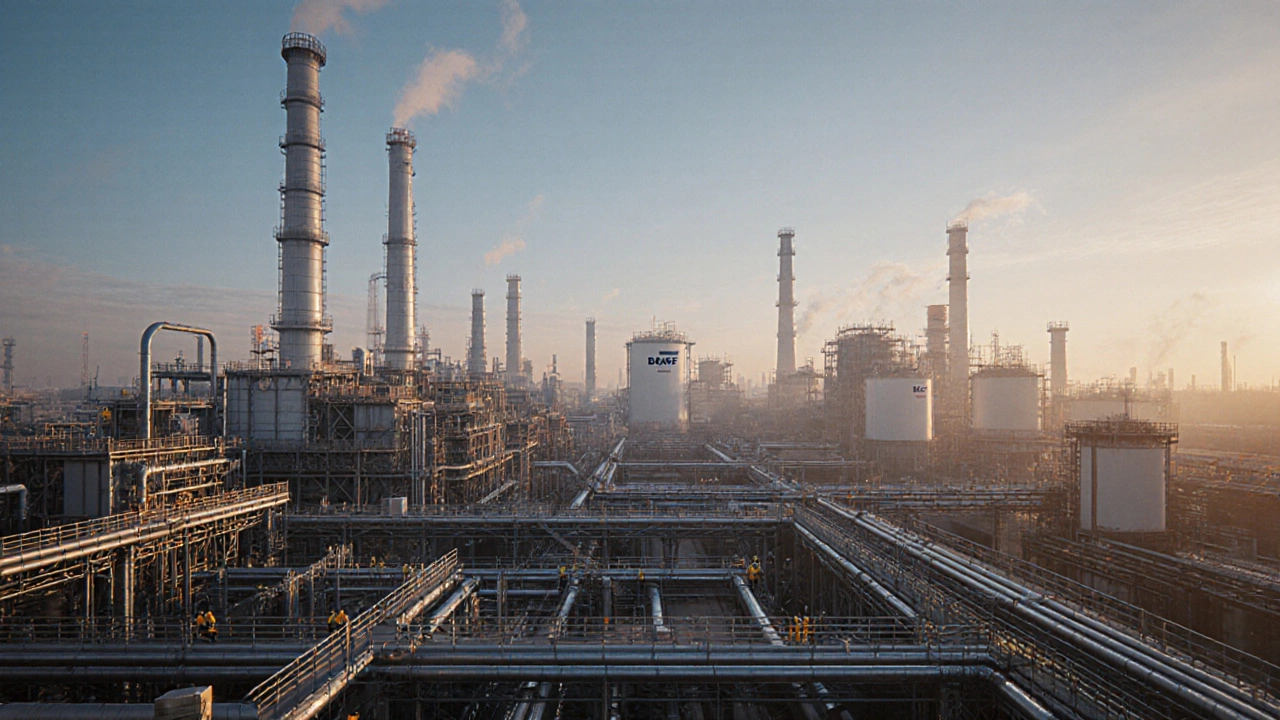
When you hear the phrase largest chemical manufacturer, you might picture a massive plant with endless pipelines, hundreds of thousands of workers, and a product line that touches everything from plastics to pharma. In 2025 the answer is clear: BASF is the world’s biggest chemical producer, outpacing rivals in revenue, capacity, and geographic reach.
Why the Question Matters
India’s chemical sector is booming, with new parks, government incentives, and a growing demand for specialty chemicals. Knowing who leads the global game helps Indian manufacturers benchmark, attract partners, and spot technology gaps. Let’s walk through the data, compare the heavy‑hitters, and see what the ranking means for the Indian landscape.
How the Global Chemical Industry Is Measured
- Revenue: Total sales for the most recent fiscal year, usually reported in US billion dollars.
- Production capacity: Metric tonnes of chemicals a company can produce per year.
- Geographic footprint: Number of countries with operating sites.
- Employee count: Gives a sense of scale and operational complexity.
Analysts like ICIS and Statista compile these figures annually. The latest 2024‑2025 reports show BASF topping the list on all four metrics.
Profile: BASF - The Undisputed Leader
Founded in 1865 in Ludwigshafen, Germany, BASF is a global chemicals powerhouse that produces everything from basic petrochemicals to high‑performance polymers. In 2024 the company posted $94 billion in revenue, operated 120 production sites across 80 countries, and reported a net capacity of 220 million metric tonnes per year. With roughly 115,000 employees, BASF invests about €4 billion annually in R&D, keeping its product pipeline ahead of market trends.
Key strengths:
- Broad portfolio - over 10,000 products spanning agriculture, automotive, construction, and consumer goods.
- Strong sustainability focus - aims to cut GHG emissions by 25% by 2030.
- Integrated value chain - from upstream raw materials to downstream specialty solutions.
Who’s Hot Behind BASF?
While BASF wears the crown, several other giants sit close behind. Below is a snapshot of the top five players as of Q2 2025.
| Company | Headquarters | 2024 Revenue (US bn) | Annual Capacity (Mt) | Employees |
|---|---|---|---|---|
| BASF | Ludwigshafen, Germany | 94.0 | 220 | 115,000 |
| Sinopec | Beijing, China | 88.3 | 210 | 140,000 |
| Dow Chemical | Midland, USA | 62.5 | 160 | 36,500 |
| SABIC | Riyadh, Saudi Arabia | 58.2 | 130 | 35,000 |
| LyondellBasell | Rotterdam, Netherlands | 44.9 | 95 | 19,200 |
Notice how the top five are spread across three continents. This geographic mix matters for supply‑chain resilience, especially for Indian firms looking to import feedstocks or export specialty chemicals.
What Sets BASF Apart From the Rest?
Three factors give BASF the edge:
- Integrated R&D network: 30 research sites, including the flagship Ludwigshafen Lab, churn out more than 2,500 patents a year.
- Digitalisation push: The company’s "ChemConnect" platform links production data, market demand, and predictive analytics, shaving 5-7% off energy use.
- Strategic acquisitions: Recent buys like Brenntag (global distributor) tightened its front‑end logistics.
These moves keep BASF agile in a market where raw material prices can swing wildly.
Implications for Indian Chemical Manufacturers
India’s chemical sector contributed about $150 billion to the economy in FY 2024, ranking 5th worldwide in production volume. Here’s what the BASF story means for local players:
- Scale up R&D: Companies like Reliance Industries are already building multi‑billion‑dollar labs. Replicating BASF’s 30‑site model can boost specialty‑chemical output.
- Embrace digital tools: Indian firms that adopt AI‑driven process control can shave up to 6% off operating costs, a figure echoed in BASF’s own results.
- Seek partnerships: Joint ventures with global leaders give access to high‑value catalysts and polymers, accelerating market entry for Indian brands.
In short, learning from the world’s biggest player can fast‑track India’s climb from a volume‑focused market to a high‑margin, innovation‑driven economy.

Recent Trends Shaping the Top Spot
Several forces have kept BASF ahead in 2024‑2025:
- Green chemistry demand: Europe’s carbon‑tax regime forced BASF to develop bio‑based solvents, capturing a €1.2 billion market share.
- Supply‑chain reshoring: Post‑COVID disruptions pushed the company to double‑down on European and North‑American plants, reducing reliance on Asian imports.
- Strategic divestments: BASF sold its agricultural chemicals division in 2023, freeing capital for high‑growth specialty segments.
These shifts are mirrored across the industry, but BASF’s speed of execution keeps it on top.
Quick Checklist: How to Benchmark Your Business Against BASF
- Calculate your annual revenue in USD and compare it to BASF’s $94 bn.
- Map your production capacity (metric tonnes) against the 220 Mt benchmark.
- Count active R&D sites - aim for at least one centre per major product line.
- Assess digital maturity: Do you have a unified data platform?
- Review sustainability metrics - target a 20% GHG reduction by 2030.
Even if you’re a small‑scale Indian player, ticking these boxes will put you on the right growth trajectory.
Frequently Asked Questions
Which company held the title of the world’s largest chemical manufacturer in 2025?
BASF, the German chemicals giant, remained the top producer by revenue, capacity, and global footprint.
How does BASF’s revenue compare with its closest rival?
In 2024 BASF reported $94 billion, while China’s Sinopec came in second with $88.3 billion - a gap of roughly $6 billion.
What are the main criteria used to rank chemical manufacturers?
Analysts look at annual revenue, total production capacity (metric tonnes), number of operating sites, and employee count.
Why does BASF’s R&D investment matter for Indian companies?
BASF spends over €4 billion on R&D each year, generating thousands of patents. Indian firms that emulate this focus can move up the value chain from bulk chemicals to specialty products.
Will the ranking change in the next few years?
The market is dynamic. Factors like green‑chemistry regulations, Asian capacity expansions, and major mergers could reshuffle the top five, but BASF’s diversified portfolio gives it a strong moat.
Knowing who leads the global chemical arena helps you set realistic goals, find the right partners, and stay ahead of regulatory trends. Keep an eye on BASF’s moves - they often signal where the whole industry is headed next.
